Success Statistics

Saint Vincent College Post-Graduation Survey Results

Post-graduation information is collected by the Career and Professional Development Center as part of the annual First Destination Survey. via paper, email and phone surveys and is reported one year after graduation. We attribute our excellent response rate – 91 percent for 2021-22 graduates – to the personal connections we make with our students during their time at Saint Vincent, as well as the relationships we maintain with our alumni. 

Saint Vincent College reports a success rate based on students who report that they are either employed or are attending post-secondary institutions in their fields of interest or academic area of study. Each year's results includes statistics for students one year after receiving degrees in August, December, and May of the preceding academic year.

First Destination Report for 2021-22 Graduates

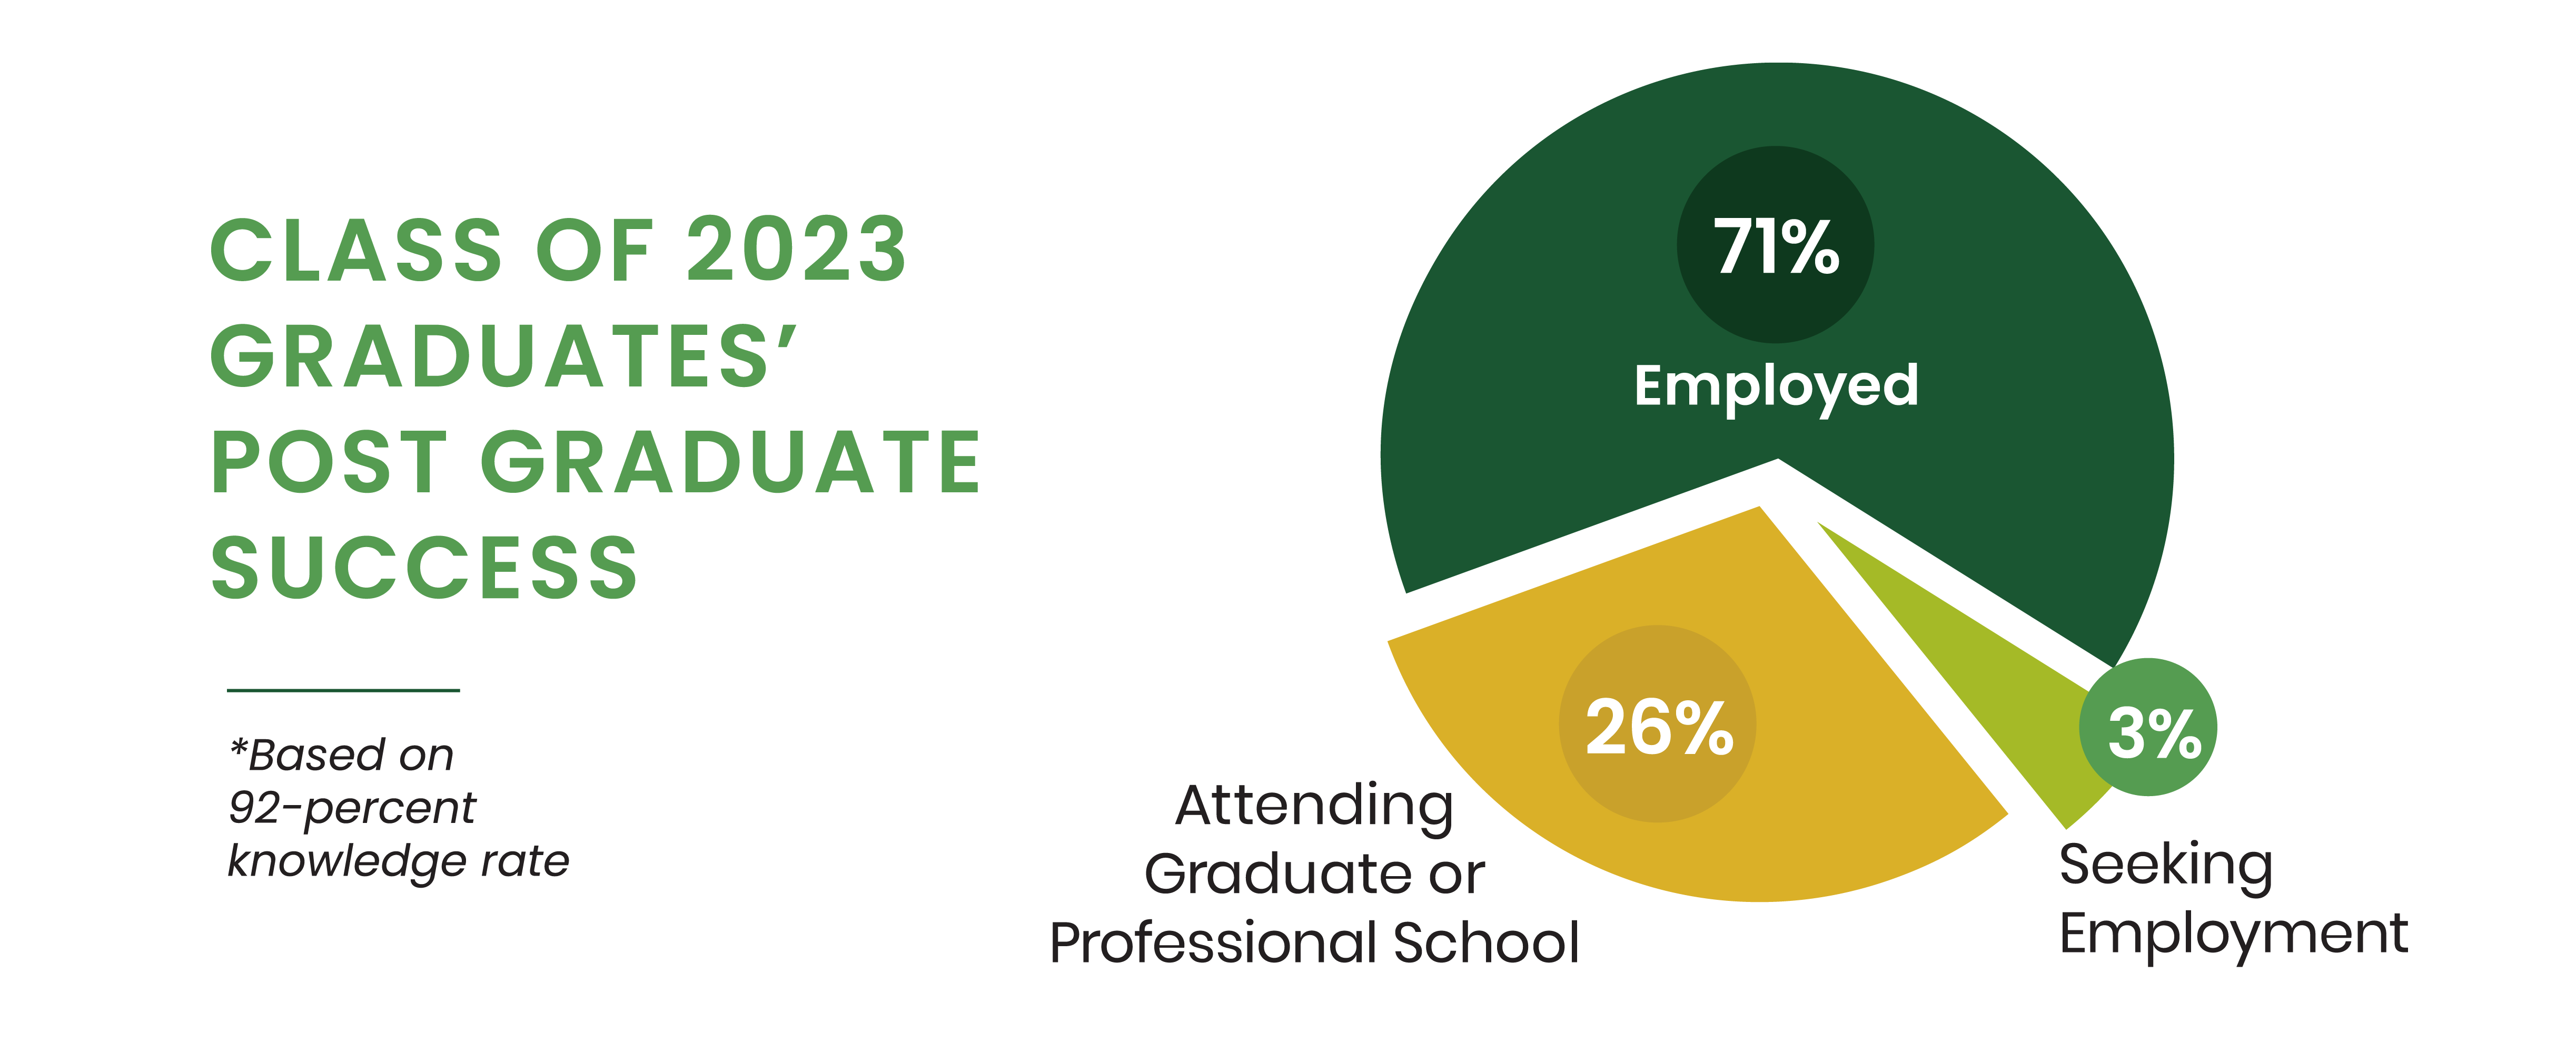
98% of members of the Class of 2022 are employed or attending graduate school within one year of graduation. This data reflects a 91% knowledge rate among our 331 graduates who completed their degrees in August 2021, December 2021, and May 2022.

2021-22-First-Destination-Survey-Overview.png


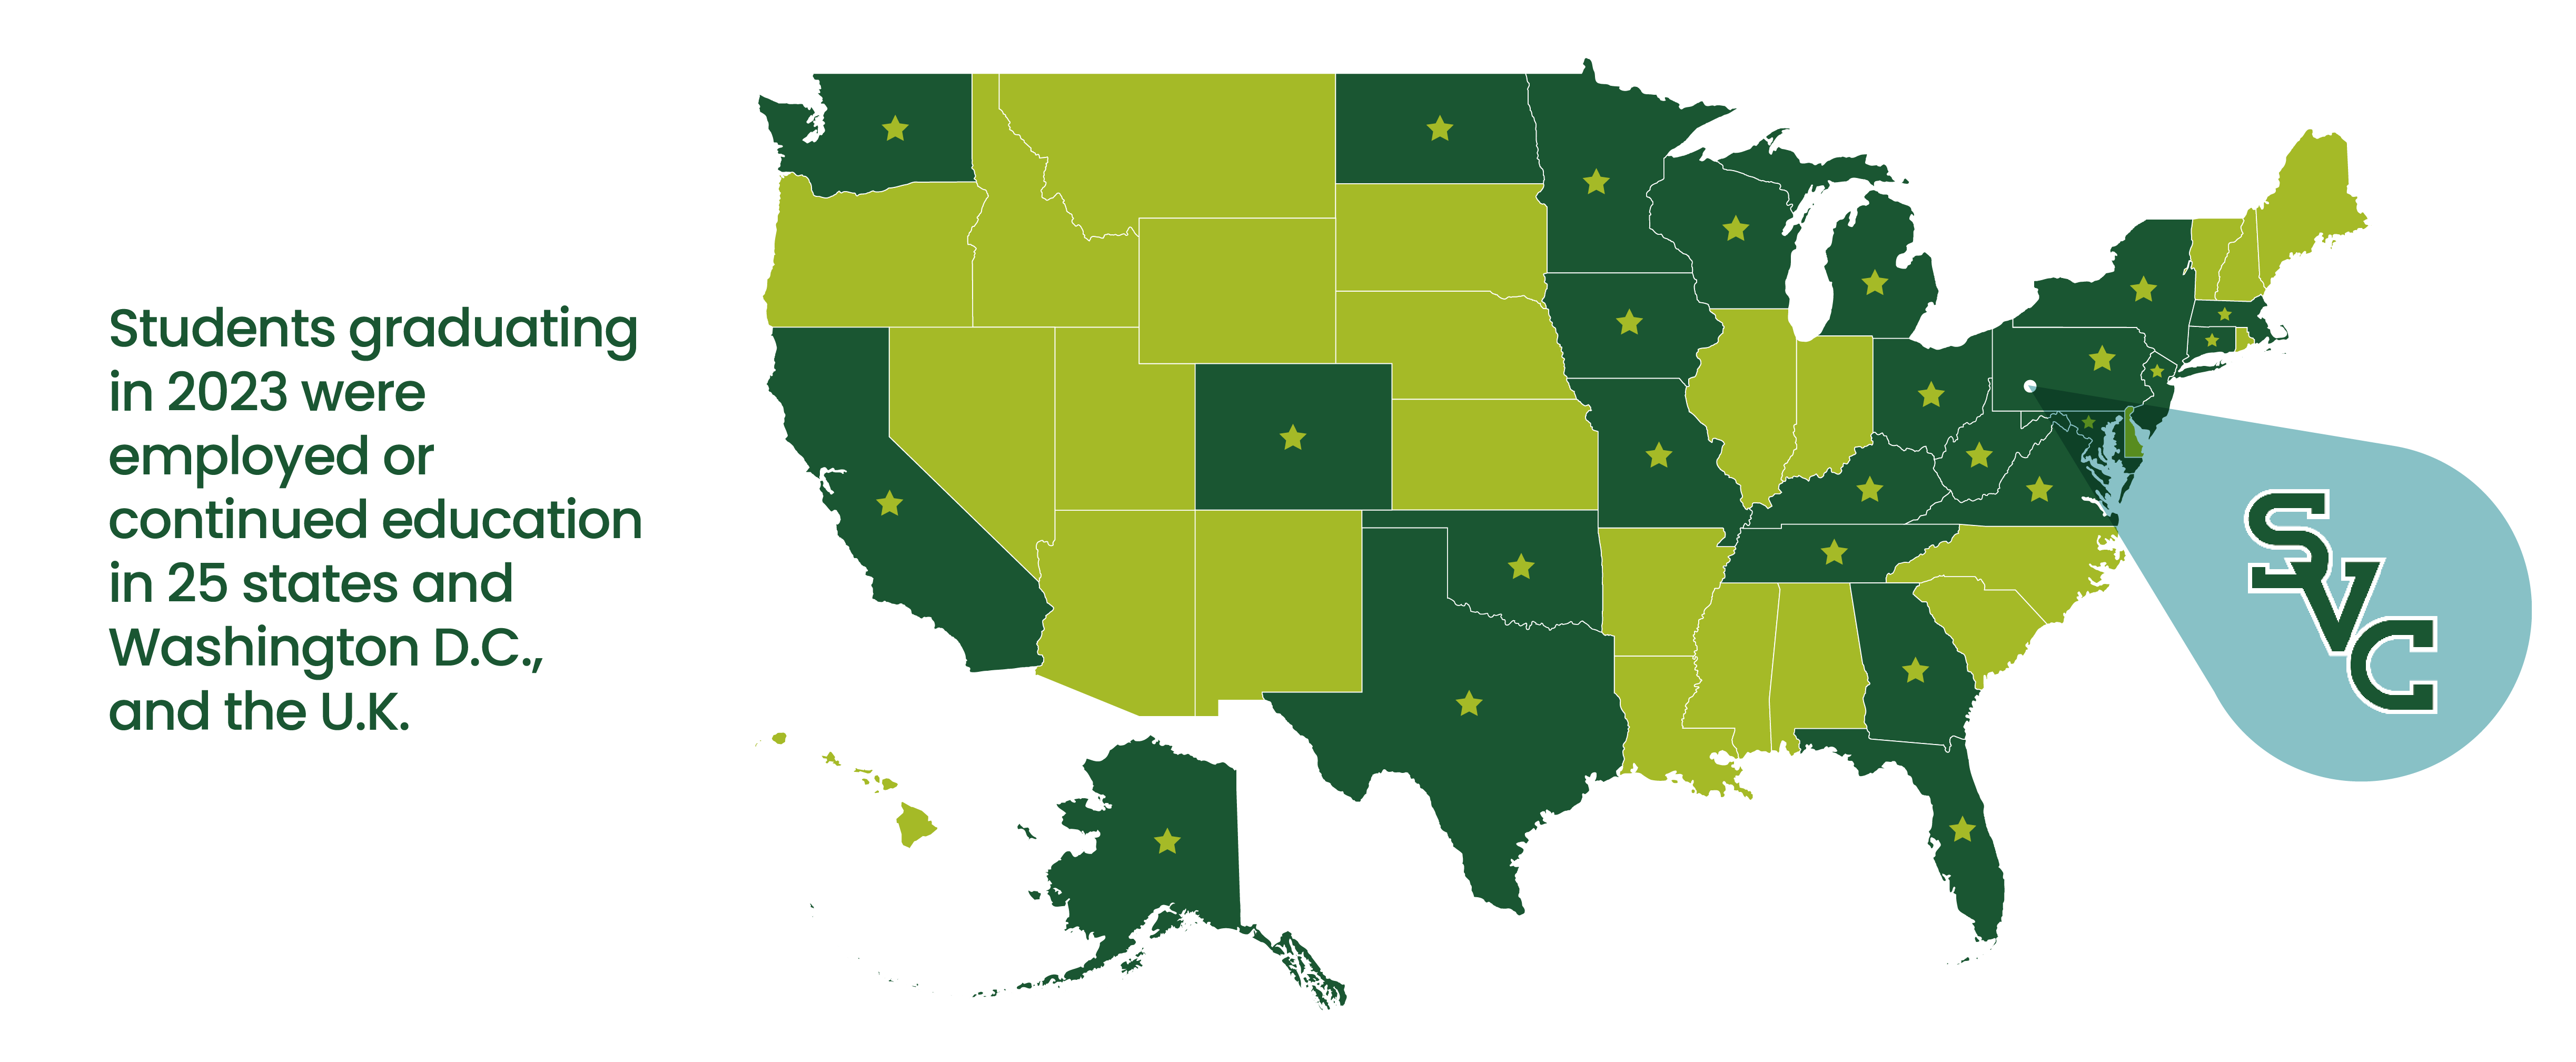
Students graduating in 2022 were employed or continued education in 20 states; Washington, D.C.; Ireland; and Hungary.

2021-22-First-Destination-Survey-Geographic-Placements.png

  • Employers Who Hired 2022 Graduates

    68% of responding graduates from the Class of 2022 were employed in their field of choice, with employers including: 

    • Baker Tilly
    • BNY Mellon
    • CBS
    • Deloitte Consulting, LLP
    • Federate Hermes
    • Johns Hopkins Medicine
    • Kennametal
    • Minnesota Vikings
    • Naval Nuclear Laboratory
    • Pfizer, Inc.
    • PPG Industries
    • QAI Aerospace
    • Sherwin-Williams Company
    • Stanley Black and Decker
    • University of Pittsburgh Medical Center
    • (UPMC)
    • US Army Corps of Engineers
    • Westinghouse Electric Company
    • And more


    Job titles of newly hired Class of 2022 graduates incude:

    • Behavioral Health Associate
    • Brroadcast Director
    • Chemist
    • Communications Specialist
    • Development Coordinator for Special Events
    • English & Media Lab Teacher
    • Environmental Scientist I
    • Graphic Designer
    • Kindergarten Teacher
    • Marketing Associate
    • Mechanical Engineer
    • Police Officer
    • Portfolio Analyst
    • Software Support Analyst
    • Staff Accountant
    • Structural Engineer
    • And more
  • Graduate and Professional Schools of 2022 Graduates

    30% of our Class of 2022 graduates matriculated into prestigious graduate and professional school institutions, including:

    • Saint Vincent College
    • Chatham University
    • Columbia University
    • Duke University
    • Duquesne University
    • Elizabethtown College
    • George Mason University
    • Illinois State University
    • Indiana University of Pennsylvania
    • Kent State University
    • Lake Erie College of Osteopathic Medicine
    • Lehigh University
    • Saint Francis University
    • Massachusetts College of Pharmacy and Health Science
    • Mercyhurst University
    • Minneapolis College of Art & Design
    • North Carolina State University
    • Ohio Northern University
    • Palmer College of Chiropractic
    • PennWest California
    • Point Park University
    • Rowan University
    • Salus University
    • Seton Hill University
    • Slippery Rock University of Pennsylvania
    • State University of New York System-
    • College of Optometry
    • Trinity College (Dublin)
    • University of Buffalo
    • University of Colorado
    • University of Florida
    • University of New England
    • University of Pittsburgh
    • University of Rochester
    • Vanderbilt University
    • Washington University in St. Louis
    • West Virginia University

Success Statistics from Previous First Destination Surveys

  • 2017-2018 First Destination Survey Results

    (Percentages include 328 total respondents out of 362 2018 graduates)


    fall-2017-18


    •  
      Alex G. McKenna School of Business, Economics & Government

      mckenna-pie-2017-18

    •  
      Herbert W. Boyer School of Natural Sciences, Mathematics & Computing

      boyer-pie-2017-18

    •  
      School of Arts, Humanities & Social Sciences

      ahss-pie-2017-18

  • 2016-2017 First Destination Survey Results

    (Percentages include 356 total respondents out of 401 2017 graduates)

    97percent-pie-horizontal


    97percent-placement


    28States

    •  
      Alex G. McKenna School of Business, Economics & Government

      mckenna school success rate pie 2016-17

    •  
      Herbert W. Boyer School of Natural Sciences, Mathematics & Computing

      boyer school success rate pie for 2016-17

    •  
      School of Humanities & Fine Arts

      hfa school success rates pie for 2016-17

    •  
      School of Social Sciences, Communication & Education

      ssce success rates pie for 2016-17